
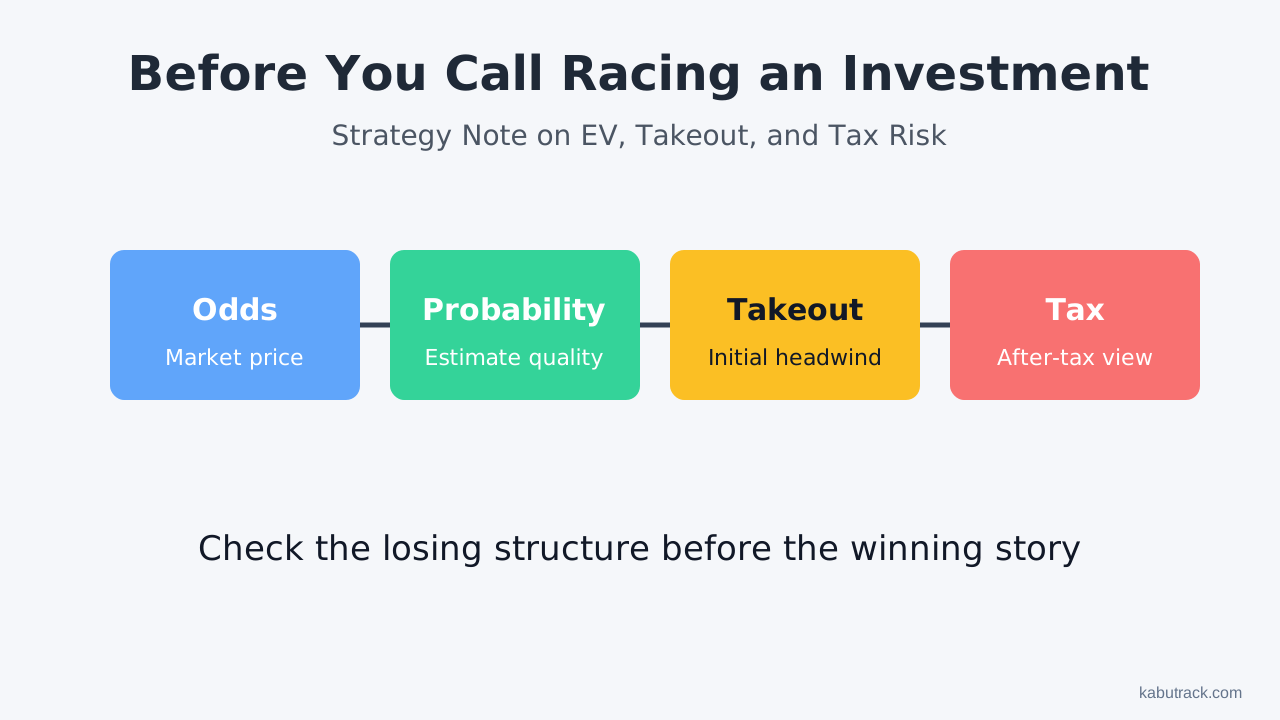
A model needs an advantage over the price
Estimated probability, market-implied probability and realized results are different measures. Odds can change, and a historical edge can disappear once tested on new data.
What this article covers
- Why horse racing is negative-sum for bettors as a group.
- Why expected value matters more than hit rate.
- How to read market-implied probability from odds.
- Why overfitting and bankroll management failures are common.
- How to think about tax, terms-of-use, and addiction risks.
First, the conclusion
- Market odds are prices that reflect the view of the betting market.
- Expected value appears only when your estimated probability is higher than the market-implied probability.
- Any edge must remain after takeout, taxes, model error, and losing-streak risk.
Why the horse racing market is negative-sum
JRA payout rates are set by bet type. As of June 2026, based on JRA's official information, win and place bets pay out at 80%, bracket quinella, quinella, and wide bets at 77.5%, exacta and trio bets at 75%, trifecta at 72.5%, and WIN5 at 70%.
In other words, the takeout rate is roughly 20% to 30%.
Suppose the betting market buys JPY 1,000,000 worth of tickets. If the payout rate is 75%, the payout pool is JPY 750,000. The remaining JPY 250,000 is taken out.
Bettor wagers: JPY 1,000,000
 ->
Takeout: JPY 250,000
 ->
Payout pool: JPY 750,000
Look at expected value, not hit rate
Expected return = estimated probability x oddsExpected ROI = estimated probability x odds - 1Suppose a horse is priced at odds of 12.0, and your model estimates its probability at 10%.
Expected return = 10% x 12.0 = 120%
Expected ROI = 120% - 100% = +20%
By contrast, even if you believe a 1.1-odds horse has an 80% chance of coming in:
Expected return = 80% x 1.1 = 88%Market-implied probability and estimated probability
Market-implied probability ~= 1 / oddsIf the odds are 5.0, the market is roughly implying a probability of around 20%.
Estimated probability > market-implied probabilityFor example, the market may be pricing a horse as if its chance is around 20%, while your model estimates 25%. If that gap truly exists, there is a price distortion.
Overfitting and loss capacity
Kelly calculations depend on an accurate estimate that may not exist. Smaller stakes do not turn negative expected value positive. Tax treatment and operator rules also require independent examination.
Dynamic edge disappears quickly
- A horse returning from a specific outside training facility.
- The interaction between a bloodline and a particular track condition.
- A horse that suffered serious traffic trouble in its previous race.
- Conditions involving a jockey or stable that tends not to attract public money.
- Inside or outside draw bias.
Discover a feature
 ->
Market money enters
 ->
Odds adjust
 ->
Expected value thins out
 ->
Search for the next distortion- Has recent ROI declined?
- Are odds for a specific condition lower than they used to be?
- Is expected ROI still there, rather than just hit rate?
- Are you chasing a feature that the market has already priced in?
Overfitting is the biggest enemy
- Running time
- Track condition
- Draw
- Distance aptitude
- Bloodline
- Jockey
- Trainer
- Course configuration
- Previous-race details
- Race spacing
- Odds movement
- Split training and validation periods while preserving time order.
- Check ROI in out-of-sample periods.
- Do not overtrust tiny samples created by overly narrow race conditions.
- Look at maximum drawdown, not only ROI.
- Check hit rate, average payout, losing streaks, and the bankroll curve together.
Evaluate risk-adjusted returns, not just expected value
| Item to check | Meaning |
|---|---|
| Average expected ROI | Theoretical edge per ticket |
| Variance | Volatility of returns |
| Maximum drawdown | How far bankroll can fall |
| Losing-streak probability | Whether the strategy can be executed continuously |
| Odds movement | Whether expected value remains at purchase time |
| After-tax return | What actually remains |
Bankroll management: think fractional Kelly, not full Kelly
f* = (p x b - q) / b| Symbol | Meaning |
|---|---|
| f* | Fraction of bankroll to wager |
| p | Estimated probability |
| q | Probability of losing, or 1 - p |
| b | Odds multiple minus 1 |
- Reduce to half Kelly or quarter Kelly.
- Set a maximum stake per race.
- Set a daily or meet-level loss limit.
- Do not increase stake size after losing streaks.
- Never use money needed for daily life.
Tax risk can be heavier than model risk
The National Tax Agency indicates that payouts may fall under miscellaneous income in cases such as when a person uses original conditions or purchase patterns, buys many tickets throughout the year, and it is objectively clear that the overall return rate over the relevant period exceeded 100%.
Keep the claim proportionate to the evidence
Drawdowns, all stakes, out-of-sample results and costs are needed to assess a strategy. An attractive backtest is insufficient evidence of future profitability or permissible automated access.
Be careful with words like automated purchase and API
Feed it into an automated order systemCheck the rules and terms of use, then maintain a purchase process and records.Minimum metrics for horse-racing quant analysis
| Metric | Why it matters |
|---|---|
| Hit rate | Frequency of wins and losses |
| Average odds | Payout level when winning |
| ROI | Return relative to purchase amount |
| Expected ROI | Expected profit per unit |
| Maximum drawdown | How much the bankroll can decline |
| Losing streak length | Psychological and bankroll durability |
| Sample size | Distinguishing luck from skill |
| After-tax return | Amount that actually remains |
Checklist for a strategy note
Check the takeout rate
 ->
Read the market-implied probability
 ->
Estimate probability
 ->
Calculate expected value
 ->
Question overfitting
 ->
Set bankroll management rules
 ->
Check tax, terms-of-use, and addiction risks
Sources
- JRA, "How are payouts calculated?" https://www.jra.go.jp/faq/pop03/1_17.html
- National Tax Agency, "Income Tax Basic Circular, Article 34: Occasional Income" https://www.nta.go.jp/law/tsutatsu/kihon/shotoku/04/08.htm
- National Tax Agency, "Taxation of horse-racing betting ticket payouts" https://www.nta.go.jp/information/other/data/h30/keiba/index.htm
- National Tax Agency, "For those who received payouts from public wagering" https://www.nta.go.jp/publication/pamph/shotoku/kakuteishinkokukankei/koueikyougi/index.htm
- JRA, "JRA measures for gambling addiction" https://www.jra.go.jp/company/social/disorder/
- Consumer Affairs Agency, "For those troubled by gambling addiction" https://www.caa.go.jp/policies/policy/consumer_policy/caution/caution_012/