
The Bottom Line
Kioxia's share-price movement illustrates a simple but easily overlooked fact: a stock can be both a major gainer and one that has fallen sharply from its peak.
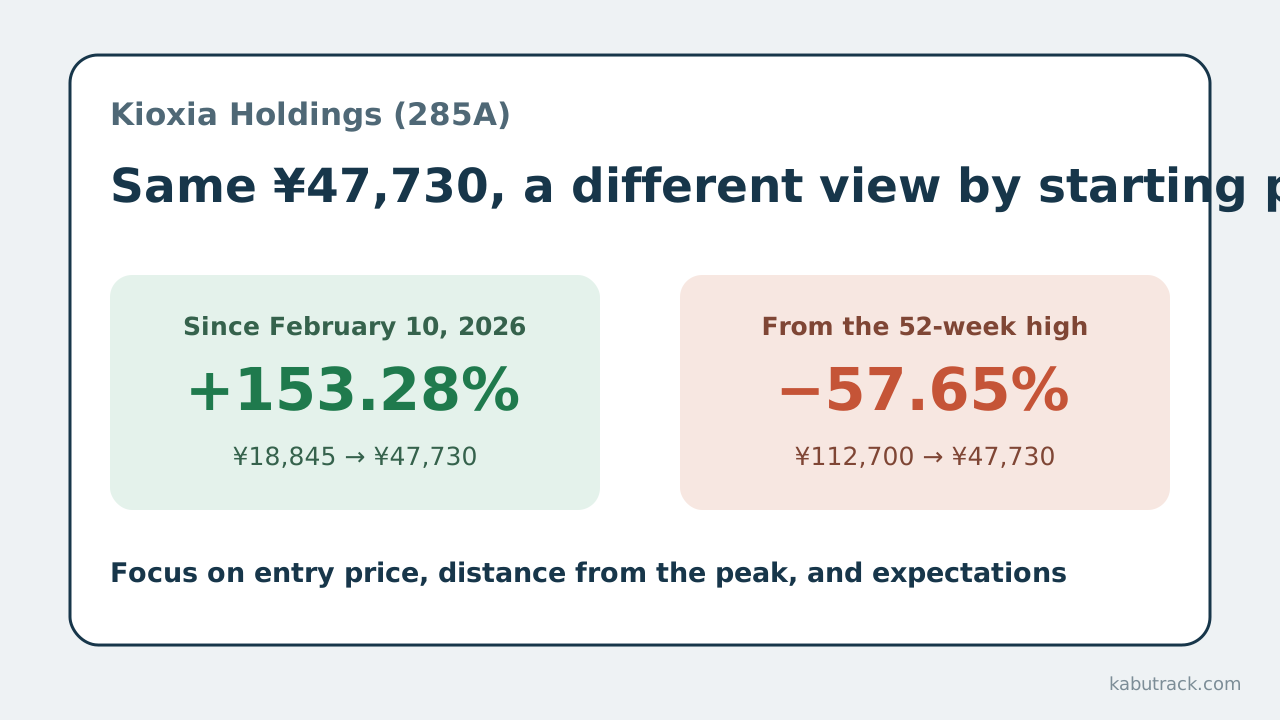
The closing price on August 7, 2026, was ¥47,730. That is 2.53 times the February 10 close of ¥18,845, but an investor who bought at the 52-week high of ¥112,700 on June 22 would see the position worth less than half the purchase price.
The company is the same. The stock is the same. What differs is the entry price. After a sharp rally, the focus shifts from how much the stock has risen to where most investors bought and whether the expectations that drove the rally remain valid.
Comparing the August 7 Price from Three Starting Points
| Starting point | Price at starting point | August 7 close | Change |
|---|---|---|---|
| February 10, 2026 close | ¥18,845 | ¥47,730 | +153.28% |
| June 22, 2026 52-week high | ¥112,700 | ¥47,730 | −57.65% |
| July 21, 2026 close | ¥61,060 | ¥47,730 | −21.83% |
The "about six months" comparison here runs from the February 10 close to the August 7 close. The starting value was not mechanically estimated by subtracting the ¥28,885 gain from ¥47,730; it is the actual February 10 closing price.
Trading on August 7 was volatile as well. The stock opened at ¥49,330, reached a high of ¥50,060 and a low of ¥44,170, and closed at ¥47,730. The intraday range was ¥5,890, equivalent to a ¥589,000 difference for 100 shares. The market capitalization shown on the stock-information screen that day was approximately ¥26.16 trillion.
Nearly a Sixfold Gain at One Point, Yet a ¥6.5 Million Unrealized Loss for Peak Buyers
From the February 10 close of ¥18,845 to the 52-week high of ¥112,700, the stock rose about 498%. At one point, it traded at roughly 5.98 times its starting price.
A simple comparison based on 100 shares makes the asymmetry even clearer. Taxes, fees, and dividends are excluded.
| Purchase timing | Purchase amount | Value on August 7 | Unrealized gain/loss |
|---|---|---|---|
| 100 shares at the February 10 close | ¥1,884,500 | ¥4,773,000 | +¥2,888,500 |
| 100 shares at the 52-week high | ¥11,270,000 | ¥4,773,000 | −¥6,497,000 |
Even though both investors hold the same 100 shares on August 7, one has an unrealized gain of about ¥2.89 million while the other has an unrealized loss of about ¥6.5 million. Finding a company with strong earnings and deciding at what price to hold its stock are separate questions.
After a 57.65% Drop, a 136% Gain Is Needed to Regain the Peak
Decline and recovery percentages are not symmetrical. A fall from 100 to 50 is a 50% decline, but returning from 50 to 100 requires a 100% gain.
For Kioxia shares to return from ¥47,730 to ¥112,700, they would need to gain ¥64,970, or about 136.12%. A stock that has fallen 58% from its high does not return to that high merely by rising 58%.
This calculation matters most when holding an unrealized loss. A sharp decline may make a stock look inexpensive, but the percentage gain required to recover the original price can be much larger than expected. A rebound from the lows and a full recovery to the peak are best treated as separate events.
Why Investors Often Buy Near the Top of a Surging Stock
When a stock multiplies in value over a short period, the rally itself attracts new buyers. Rather than buying after studying strong earnings or a growth theme, investors may increasingly act on FOMO—the fear of missing out because the price keeps rising.
During a rally, valuations that appear expensive are also often justified by future growth. The stronger the expectations for AI SSD demand and the NAND market, the faster positive developments are priced into the stock. That is where things become difficult. Even strong earnings can trigger profit-taking if they fail to beat expectations. If concerns about major-shareholder sales coincide with the unwinding of margin positions, the decline can accelerate.
Price action alone, however, cannot identify a single cause for the decline. A reduction in the holdings of Bain Capital-affiliated shareholders, margin supply and demand, and a broader correction in memory stocks are all factors to examine, but public information alone cannot establish causality between individual market participants' trades and the price decline.
A Weak Stock Price Does Not Necessarily Mean a Weak Company
Kioxia's core businesses are NAND flash memory and SSDs, so its earnings depend not only on product demand but also on NAND prices, shipment volumes, product mix, factory utilization, and capital expenditure. Even if demand for AI storage grows, the share price can rise faster and price in too much of that future upside.
Therefore, the fact that the stock has fallen to less than half its peak does not by itself show either that the company's growth story has broken down or that the shares have become sufficiently cheap. After a price decline, the key is to compare initial expectations with actual performance.
Numbers to Watch from Here
| Item to monitor | Why it matters for the stock price |
|---|---|
| NAND prices and shipment volumes | Whether the market recovery is continuing |
| Data-center and enterprise sales | Whether AI-storage expectations are turning into real demand |
| Operating margin and operating cash flow | Whether better market conditions are translating into profit and cash |
| Capital expenditure and competitors' expansion plans | Whether the risk of future oversupply is increasing |
| Major-shareholder stakes, margin balances, and trading volume | Whether the market can absorb selling into a recovery |
The bullish scenario is that demand for AI SSDs and NAND prices remain firm, allowing profit and cash flow to exceed elevated expectations. The bearish scenario is that weaker demand or capacity expansion by competitors reverses the market, causing expectations-led valuations to contract further. The three-for-one stock split scheduled for October 1 will lower the minimum investment amount, but the split alone will not change the company's value or make its shares cheaper.
Conclusion
As of August 7, 2026, Kioxia shares had risen 153.28% since February 10 while falling 57.65% from their 52-week high. There is no contradiction; the starting points are simply different.
For a surging stock, its past gain does not directly indicate how much upside remains. Considering four factors together—your entry price, the distance from the peak, the gain required to recover the previous price, and the level of earnings implied by the current valuation—makes it easier to avoid being swayed by the chart alone.
Related Pages
- Kioxia Holdings (285A) stock page
- Reading Kioxia's surge and plunge through supply and demand
- Real-world examples of buying at the top | How to assess them in the market