First, the conclusion
Performance is strong. However, we are past the stage where the focus of evaluation is solely on sales growth.
In the fiscal year ending December 2025, sales were 34.285 billion yen and operating income was 2.768 billion yen, both of which were double-digit growth. Total domestic retail sales increased to 67.9 billion yen, and the number of domestic stores increased to 1,066. It is not enough to explain that the company is recovering after the coronavirus pandemic; the numbers show that the company is renovating its stores, opening new stores, encouraging people to buy multiple items, and increasing the number of app members.
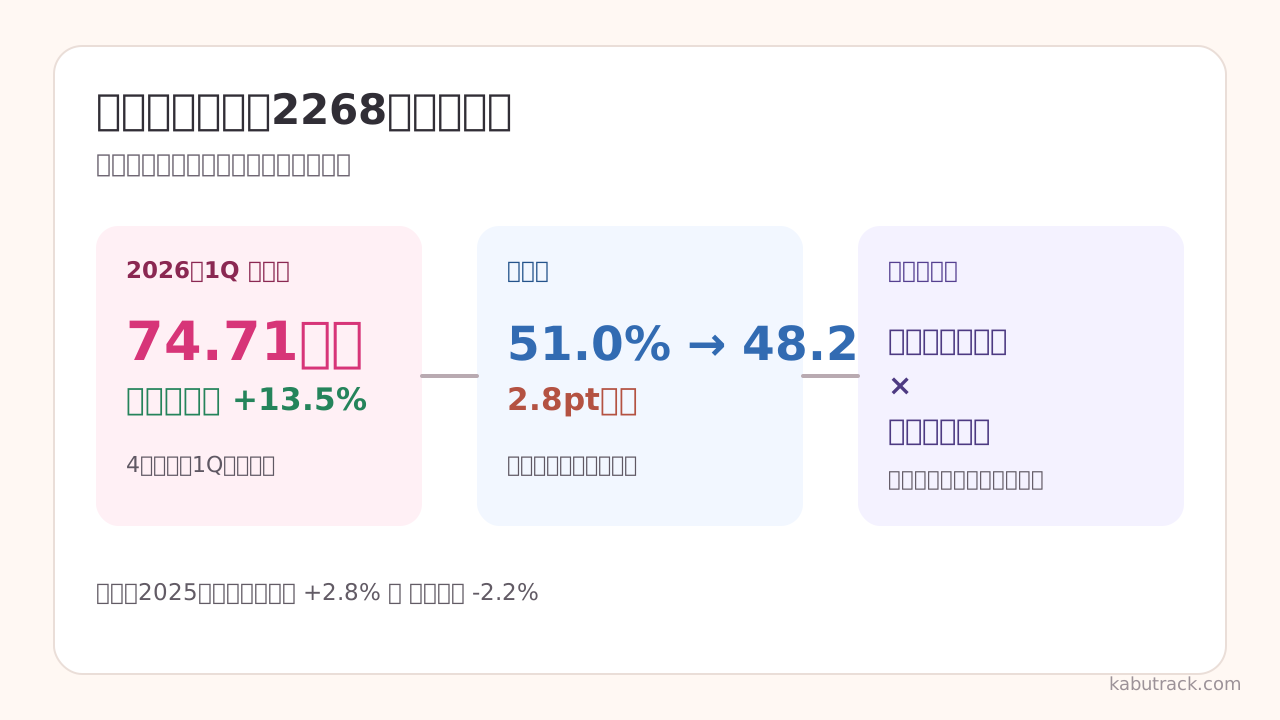
However, in the first quarter of 2026, sales increased by 13.5%, but operating profit decreased by 4.2%. Gross profit margin decreased from 51.0% in the same period of the previous year to 48.2%, and operating profit margin decreased from 6.4% to 5.4%. This is because higher raw material prices, weaker yen, logistics costs, and costs to expand sales bases outweighed the effects of increased sales.
From this point on, it is time to look at profit margins rather than sales. The company's plan also calls for a 2.2% increase in operating income for the fiscal year ending December 2026, which is slower than the 4.5% increase in sales. The assumption is that sales will continue to increase, and the room for upside will be determined by the gross profit margin and the ability to absorb SG&A expenses.
Company overview and profit structure
The company is the franchise headquarters for ice cream specialty stores, and is responsible for manufacturing and supplying products, leasing store equipment, and providing management guidance. Because many of the stores are franchised, fixed costs are different from businesses that operate all retail stores directly.
However, it is not simply a "royalty company with no assets." It owns factories, production equipment, and store equipment for franchisees, and its investment cash flow for the fiscal year ending December 2025 was 4.336 billion yen. Operating cash flow is about the same size as 4.456 billion yen, and the burden of investment in manufacturing capacity and store network is not light.
When looking at profits, it is necessary to track how the growth in total domestic retail sales has affected product sales and royalties, and whether the increase has exceeded raw material costs, logistics costs, advertising costs, and capital investment.
Latest performance: How do you view the quality of revenue increase?
| Indicators | December 2025 | 2026 1Q | View |
|---|---|---|---|
| Sales | 34.285 billion yen (+11.7% compared to the previous year) | 7.471 billion yen (+13.5% compared to the same period last year) | Store increase and sales per store continue to grow |
| Operating income | 2.768 billion yen (+17.1%) | 403 million yen (-4.2%) | 1Q sales increased but operating income decreased |
| Operating profit margin | 8.1% | 5.4% | 1.0 point decrease compared to the same period last year |
| Ordinary profit | 2.861 billion yen (+19.9%) | 425 million yen (+12.3%) | 1Q also contributed to a reversal in foreign exchange gains |
| Net income | 1.770 billion yen (+14.7%) | 272 million yen (+12.4%) | Double-digit profit increase, but viewed separately from core business profit |
Ordinary profit for 1Q 2026 increased by double digits, but in non-operating areas, a foreign exchange loss of 39 million yen was recorded in the same period of the previous year, while in the current period there was a foreign exchange gain of 28 million yen. Operating profit, which represents the profitability of the company's main business, is decreasing. The headline alone says `Increase in sales and final profit,'' but the content is `Increase in sales, Decrease in gross profit margin, and Decrease in operating income.''
The company stated that its 1Q operating profit exceeded its internal target, and also left its full-year forecast unchanged. Moreover, the gross profit margin in the full-year plan is 48.0%, which is assumed to be lower than the 2025 actual result of 49.6%. The 48.2% in 1Q is close to the planned line and is not a number that can be immediately concluded as a slowdown in performance. The next thing to check is whether you can increase sales during the busy season and keep the SG&A expense ratio down.
Market trends: Even though the amount is increasing, the quantity is decreasing
According to the Japan Ice Cream Association, ice cream sales in fiscal 2025 will reach 663.1 billion yen, an increase of 2.8% from the previous year and a record high for the sixth consecutive year. In contrast, sales volume was 915,645 kiloliters, a decrease of 2.2%. The unit price per liter increased by 5.1%.
The market is expanding. However, the main reason for this is not a steady increase in volume, but rather price revisions and higher added value. If people become more conscious of protecting their lifestyles, there is room for them to reduce the frequency of their purchases of premium products and restaurant-style desserts. While the description of ice cream as a ``seasonless luxury'' represents an aspect of consumer behavior, calling it defensive is a bit harsh. Affected by temperature, holidays, number of customers at commercial facilities, and disposable income.
Among these, Thirty One's total domestic retail sales in 2025 exceeded the previous year, and annual retail sales per store increased to 64.49 million yen. Although a simple comparison cannot be made because the period and scope of data collected differ from industry statistics, it can be seen that the company is accumulating measures that go beyond simply increasing market prices.
Three mechanisms to support growth
Buying multiple items and “31 Patisserie”
The design, which uses new flavors as an entry point to lead customers to double and variety boxes, increases the number of items purchased without relying solely on the number of customers visiting the store. ``31 Patisserie'', a new category of ice cream cakes, is also a measure to expand usage situations such as home demand, souvenirs, and birthdays.
What we want to see here is not the spread of the brand name, but whether the product mix, which includes ice cream cakes, is pushing up the average purchase amount and gross profit. Even if the number of products increases, if manufacturing and store operations become more complex, it will be a headwind for profit margins.
The power to connect app members to sales
As of the end of 1Q 2026, the number of 31Club members exceeded 11 million, and member purchases accounted for 44.1% of total sales. Rather than the number of members, we want to track the frequency of purchases, repeat visits after using coupons, and mobile order ratio.
When it comes to digital initiatives, it is not profitable to simply attract members using advertising costs. If you can incorporate demand forecasting, order placement, shift creation, and shortening order waiting time into store operations, it will help reduce labor shortages and waste. I would like to check profit contribution not by the number of members, but by the SG&A expense ratio and sales per store.
Expansion of sales bases
The number of domestic stores at the end of 1Q 2026 was 1,078, an increase of 40 stores from the end of the same period last year. There were 431 domestic sales locations other than regular stores, and 52 in Taiwan and Hawaii, for a total of 1,561 sales locations.
A strategy to expand contact not only with new commercial facilities but also roadside, station fronts, business districts, airports, and service areas will reduce dependence on summer and large commercial facilities. However, it cannot be determined based on the number of store openings alone. The quality of growth can only be determined by looking at the launch of new stores, cannibalization of existing stores, profitability of franchisees, and recovery period for renovation investments.
Interpretation in the stock market
The expected PER is approximately 22 times, simply calculated from the July 22, 2026 closing price of 4,110 yen and the company's forecast EPS of 186.80 yen. PBR based on net assets per share at the end of 1Q 2026 will be approximately 2.7 times. The stock price has been moving within a narrow range since the beginning of 2026, with a year-to-date low of 3,990 yen and a high of 4,175 yen, with no major direction apparent until recently.
It is best to think that this evaluation takes into account the stability of business performance, brand, and demand for benefits and dividends to some extent. The company's forecasted net income growth rate is only 1.6%, so it's hard to say that the company is clearly undervalued based on the P/E ratio alone. Even if good sales continue, if the operating profit margin does not recover, the potential for a valuation to improve is likely to be limited.
On the other hand, if the decline in the gross profit margin falls within the company's expectations and the SG&A expense ratio improves during the busy season, the outlook will change. What the market is waiting for is not another sales record, but proof that increased sales will once again turn into increased operating profits.
Bullish scenario
- The number of purchases continues to increase from new products and collaborations to doubles, variety boxes, and ice cream cakes.
- 31Club and mobile ordering not only improve store visit frequency but also store productivity
- New stores and sales locations other than regular stores will not encroach on existing stores and boost total domestic retail sales.
- Absorb the impact of high raw material prices and weak yen during busy seasons by improving procurement and manufacturing efficiency
In this case, the profit growth rate in 2026 will exceed the company's plan, and there is room for revisions to the outlook that is based on the assumption that growth will slow.
Bearish scenario
- In response to market growth due to higher prices and higher added value, consumer purchasing quantities will further decline
- Raw materials, foreign exchange, logistics costs, and labor costs continue to rise, and the gross profit margin remains at around 48%.
- Sales of new stores did not rise as expected due to heavy upfront costs for opening stores and advertising.
- Growth in same-store sales and sales per store will slow down due to backlash from collaboration and reliance on sales promotions
Of particular concern is a case in which expectations remain high due to strong performance in 2025, but only profit growth settles to a low level. Even if sales records continue to be broken, if the operating profit margin falls, it will be difficult to see new value in the stock price.
Featured KPIs
| KPI | Reasons to check |
|---|---|
| Gross profit margin/operating profit margin | Determine whether the decline in 1Q 2026 is within the plan or an additional deterioration |
| Total domestic retail sales | View demand across the entire store network |
| Existing store sales | View brand performance excluding store opening effects |
| Retail sales per store | Check whether growth is not dependent solely on the number of stores |
| 31Club member sales composition ratio | See whether member acquisition is leading to actual sales |
| Mobile order ratio/store productivity | See if digital investment improves SG&A expense ratio |
| Number of domestic stores and total number of sales locations | Tracking the balance between store opening pace and profitability |
| Operating CF and capital investment | Check whether cash remains after investing in factories and stores |
[Summary]
B-R Thirty One Ice Cream's sales growth cannot be explained solely by industry tailwinds. The combination of the store network, renovations, apps, multiple purchases, and collaborative products led to sales records for the full year of 2025 and the first quarter of 2026.
However, the gross profit margin decreased in 1Q 2026, resulting in a decrease in operating profit. It is too early to evaluate a company's core business highly based on double-digit increases in ordinary income and net income. Profit over sales, cash over profit. In the next financial results, I would like to see how sales during the busy season have changed into gross profit margin and operating cash flow.
Related pages
- B-R Thirty One Ice Cream (2268) stock analysis
- Financial results for the first quarter of the fiscal year ending December 2026
- Fiscal year ending December 2025
Source
- B-R 31 Ice Cream “IR Information”
- B-R 31 Ice Cream "Financial Results Presentation Materials"
- B-R 31 Ice Cream “31 Quick Guide”
- Japan Ice Cream Association “2025 Sales Performance”
Financial figures and measures are based on financial results for the fiscal year ending December 2025, published on February 9, 2026, and financial results for the first quarter of the fiscal year ending December 2026, published on April 23, 2026. The stock price is the closing price on July 22, 2026, and the PER and PBR are simply calculated from the closing price and the company's disclosed value.