
First, the conclusion
Past data shows that ``stocks are more likely to be bought back the day after a sharp decline.'' However, it is not the 8-2 record that will determine the direction of July 29th. Either the sell-off in semiconductor stocks that was concentrated on July 28th has come to an end, or the basis for the sell-off tends to disappear within a day. These two points come first.
To be honest, this time it's not just a simple panic selloff. Mid-term issues such as competition with Chinese semiconductor memory and manufacturing equipment companies, profitability of AI investment, and consolidation of margin purchases are mixed in. Even if the price rebounds after a close move, it cannot be determined that the previous day's downtrend has ended.
Why did the price drop by 2,566 yen on July 28th?
On July 28, the Nikkei average was down 3.95%. At one point, the price fell to 61,923.60 yen, a drop of more than 3,000 yen from the previous day's closing price. TOPIX's decline rate was 2.52%, with the Nikkei average's decline being greater. It was a day when the market as a whole did not sell with equal strength, but the selling was biased towards AI and semiconductor stocks, which have a high contribution to the index.
The selling point was the drop in semiconductor stocks in the US market the previous day. This coincided with reports that Chinese companies had begun manufacturing immersion-type DUV exposure equipment, intensifying competition in the memory market, and a sharp drop in Korean stocks. In Japan, Kioxia HD (285A) fell to a ceiling, and declines in stocks such as Tokyo Electron (8035), Advantest (6857), and Lasertec (6920) amplified the index.
In other words, the downward path will be as follows:
Semiconductor stocks in the US and South Korea fall → Concerns about competition with Chinese companies → Japanese prices concentrate selling on semiconductor stocks → Clearance of margin buying and futures selling → Nikkei average decline widens.
All 11 times the closing price fell by more than 2,000 yen and the reason for the crash
According to the Nikkei 225 Profile's ``Record of Rise and Fall'', there have been 11 days in which the decline in the closing price exceeded 2,000 yen until July 28, 2026. The main reasons behind the sell-off were summarized without conclusively determining the market factors on the day.
| Ranking | Date of sharp decline | Range of decline | Closing price of the day | Main background/selling route | Next business day |
|---|---|---|---|---|---|
| 1 | August 5, 2024 | -4,451.28 yen | 31,458.42 yen | Concerns about US economic recession, rapid appreciation of the yen after the Bank of Japan interest rate hike, unwinding of yen carry trades, margin calls and futures selling | +10.23% |
| 2 | October 20, 1987 | -3,836.48 yen | 21,910.08 yen | US Black Monday on October 19 spread to the world market. Programmed trading and illiquidity amplify the decline | +9.30% |
| 3 | June 26, 2026 | -3,005.46 yen | 69,360.88 yen | Profit taking from the previous day's 3,000 yen high, concerns about AI investment slowing down due to memory price rise, Korean semiconductor stock decline, expectations for OpenAI listing receding | +0.15% |
| 4 | March 9, 2026 | -2,892.12 yen | 52,728.72 yen | Concerns about protracted conflict in the Middle East and sharp rise in crude oil prices. Be wary of import costs, inflation, and economic deterioration at the same time | +2.88% |
| 5 | July 17, 2026 | -2,694.42 yen | 64,141.12 yen | US SOX drop, liquidation of holdings in Asian semiconductor stocks, Middle East/oil risk, Kioxia lawsuit disclosure and stop price | +3.26% |
| 6 | April 7, 2025 | -2,644.00 yen | 31,136.58 yen | Wary of trade war and economic recession due to US mutual tariffs and China's retaliatory measures. Plump in US stocks spreads to Asian markets | +6.03% |
| 7 | July 28, 2026 | -2,566.27 yen | 62,364.92 yen | US semiconductor stocks fall, concerns about competition in China's memory and DUV equipment, South Korean stocks fall, deterioration in supply and demand for expensive semiconductor stocks | Undetermined |
| 8 | June 23, 2026 | -2,565.58 yen | 69,788.38 yen | A rebound after rising by more than 8,000 yen in 8 business days and hitting a new high for 6 consecutive days. Profit taking centered on AI/semiconductor stocks | -0.88% |
| 9 | June 8, 2026 | -2,563.52 yen | 64,024.60 yen | Expectations for a US interest rate hike due to strong US employment statistics, cash selling in preparation for US high-tech IPO, and Middle East risks combine | +2.17% |
| 10 | August 2, 2024 | -2,216.63 yen | 35,909.70 yen | Deterioration of US economic indicators, appreciation of the yen after the Bank of Japan interest rate hike, and concerns about the performance of exporting companies. Risk aversion accelerates ahead of the weekend | -12.40% |
| 11 | March 4, 2026 | -2,033.51 yen | 54,245.54 yen | Overall decline due to the situation in Iran, falling US semiconductor stocks, plummeting Korean stocks, and private credit concerns | +1.90% |
What you can see from this table is that even though the price is 2,000 yen cheaper, the content is different. In 1987 and August 2024, shocks and position cancellations originating overseas spread throughout the market. In June and July 2026, there were many days when the adjustment in expected values of AI and semiconductor stocks, which had been increasing rapidly, was significantly reflected in the Nikkei average.
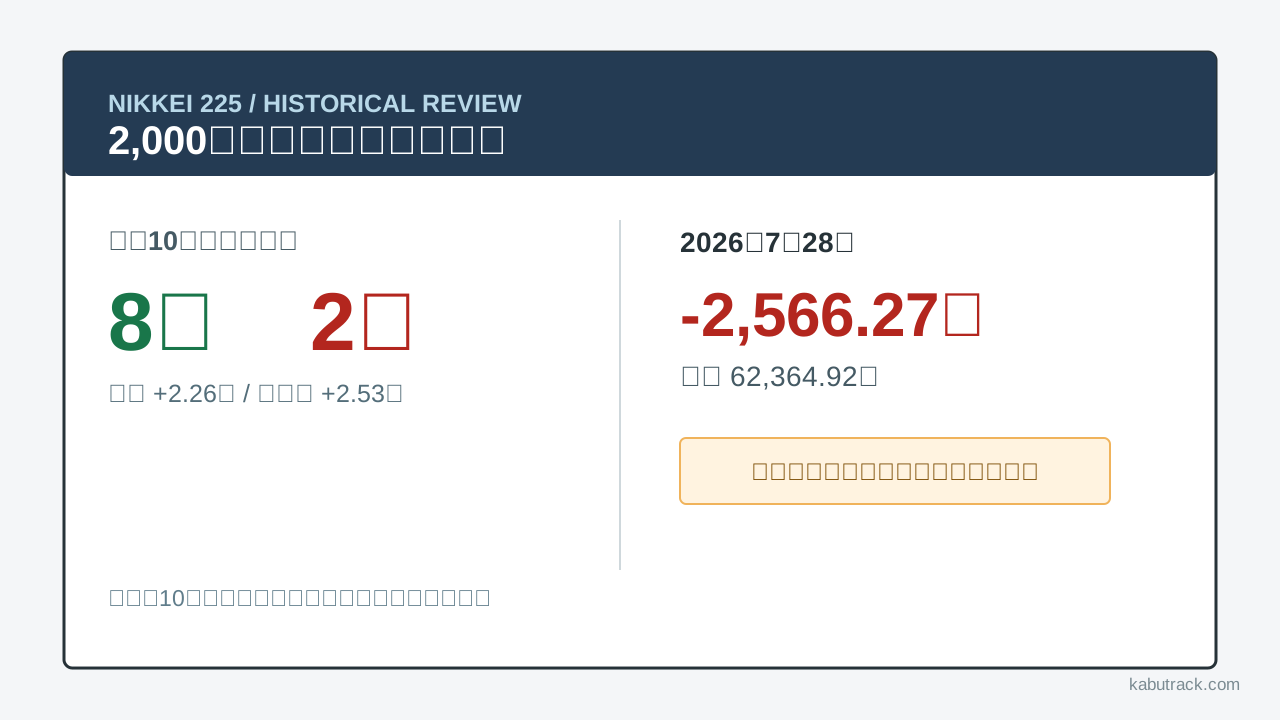
The next day of the last 10 times, 8 times rose and 2 times fell.
In the 10 following business days, excluding July 28, the stock rose 8 times and fell 2 times.
| Metrics | Results |
|---|---|
| Rise | 8 times |
| Fall | Twice |
| Increased proportion within sample | 80% |
| Average increase/decrease rate for the next day | +2.26% |
| Next day median | +2.53% |
The average includes a 9.30% gain on October 21, 1987 and a 10.23% gain on August 6, 2024. On the other hand, the next business day of August 2, 2024 was 12.40% lower. Looking only at the average price hides both the sharp rebound and the double drop.
If we mechanically apply the median price of 2.53% to the closing price on July 28, it would be around 63,943 yen, an increase of about 1,578 yen. However, this is not an expected value. This is a reference calculation that simply replaces the center of the past 10 cases with the current stock price level.
Why "8 wins, 2 losses" cannot be called an 80% increase probability
Only 10 specimens
In the 10 cases, one result moves the ratio by 10 points. It is not on a scale that can be called a statistically stable law.
Cases are not independent
August 2, 2024 and August 5, 2024 are consecutive same steep decline phases. The five cases from June to July 2026 also occurred in the same market environment where funds were concentrated in AI and semiconductor stocks.
There is a bias in the stock price level based on the monetary standard of “2,000 yen”
The 3,836 yen depreciation on October 20, 1987 was a 14.90% depreciation. The 2,566 yen depreciation on July 28 is a 3.95% depreciation. If the Nikkei average is in the 60,000 yen range, the decline in yen terms will be greater even if the rate of decline is the same. The reason why 6 out of 11 were concentrated in 2026 is partly due to the rise in market prices.
In historical comparisons, it is more accurate to look at not only the extent of the decline, but also the rate of decline, the difference with the TOPIX, the number of stocks that have declined, the Nikkei 225 VI, futures, and foreign exchange.
What the two failures to rebound show
August 2, 2024: Bad news intensified over the weekend
On August 2nd, the price was 2,216.63 yen lower, and on the next business day, August 5th, it was further down by 4,451.28 yen. This was due to concerns about an economic recession following the US employment data, the appreciation of the yen in response to the narrowing of the Japan-US interest rate differential, and the unwinding of yen carry trades, which accelerated over the weekend.
More important than the fact that the stock had already fallen significantly was the negative news and increased position liquidation after the Tokyo market closed.
June 23, 2026: High price warning did not disappear in one day
Until just before June 23rd, the price had risen for 8 consecutive business days, and the increase during that period exceeded 8,000 yen. The following day, on the 24th, the stock fell 0.88%, but the rate of decline has slowed. Rather than a new crisis, this is more like a case of continued profit-taking at high prices.
Three scenarios for July 29th
Autonomous repulsion
A case in which a short-term fire sale comes to an end due to a sudden drop in trading value from the previous day, and semiconductor stocks are repurchased. If Advantest and Tokyo Electron both rise and the Nikkei average returns above the TOPIX, this trend will be strong.
However, Advantest's financial results are scheduled to be announced at 3:30 pm on July 29th, and the US FOMC will also be held. Even if there is a buyback, funds to chase the top price before the event are likely to be limited.
Stalled after morning high
In the market, there will be a return led by futures, but there will be some selling in stocks with a lot of margin buying, such as KIOXIA, and there will be an increase in selling from the latter half of the previous market. Even on days when the stock has experienced a "next day rise" in the past, if the price range during the day is large, the perception will not be a stable rebound.
Double lowering
A case in which semiconductor stocks hit a new low on the previous day, and selling spreads to TOPIX as well. Concerns about competition with China, memory supply and demand, and the profitability of AI investments will not be resolved by a one-day drop in prices. If the selling of overpriced stocks is combined with futures selling and credit restructuring once again, the Nikkei average is likely to fall more sharply.
5 items to check after visiting
- Will Kioxia HD be able to break away from the previous day's stop low?
- Will Advantest and Tokyo Electron rebound together?
- Is the return of the Nikkei average stronger or weaker than the TOPIX?
- Can the previous market low price be maintained until the second market?
- Will selling continue in Korea KOSPI and SK Hynix?
Of these, what I most want to see is the difference between the Nikkei average and TOPIX. If only the Nikkei 225 average is weak, the adjustment in value continues to be biased towards semiconductor stocks. If both indexes decline in unison and the number of declining stocks increases, it is easy to conclude that risk aversion has spread throughout the market.
[Summary]
In the past 10 times, the stock has fallen by more than 2,000 yen and rose the next business day eight times. This result is consistent with the market structure in which short-seller buybacks and push-purchases tend to occur after a sharp sell-off completes a period of forced selling.
Still, this is not a situation where we can read "it's 80% so it's going to go up." The July 28 drop was due to short-term oversold semiconductor stocks and medium-term concerns about competition with Chinese players and the profitability of AI investments. Even if there is a rebound, it does not necessarily mean that the valuation adjustment for semiconductor stocks is over.
The color of the closing price is not the only thing to watch on July 29th. Will the funds with trading proceeds return to semiconductor stocks, will they be able to maintain the previous day's low price, and will the selling spread to TOPIX? These three points reflect the future of the market better than the number of rebounds the next day.
Related pages
- Semiconductor stock morning edition: July 29, Advantest financial results and FOMC confirmed
- [Semiconductor stocks continue to fall significantly | China DUV report, NVIDIA decline, holding adjustment before settlement] (/news/market/2026/07/28/semiconductor-selloff-duv-ai-earnings.html)
- Nikkei average 2,694 yen decline | 5 reasons for the decline on July 17
- NAND flash market analysis | eSSD for AI and supply constraints
Source
- Nikkei 225 Profile "Rise/Decrease Record" (Decrease range until July 28, 2026)
- Nikkei Average Profile "1980s: From Black Monday to Bubble"
- Bank of Japan “Governor Press Conference July 31, 2024”
- U.S. Bureau of Labor Statistics "The Employment Situation - July 2024"
- The White House “Executive Order 14257”
- Nasdaq Global Index Watch “SOX Historical Data”
- Federal Reserve Board “FOMC calendars”