The Main Point
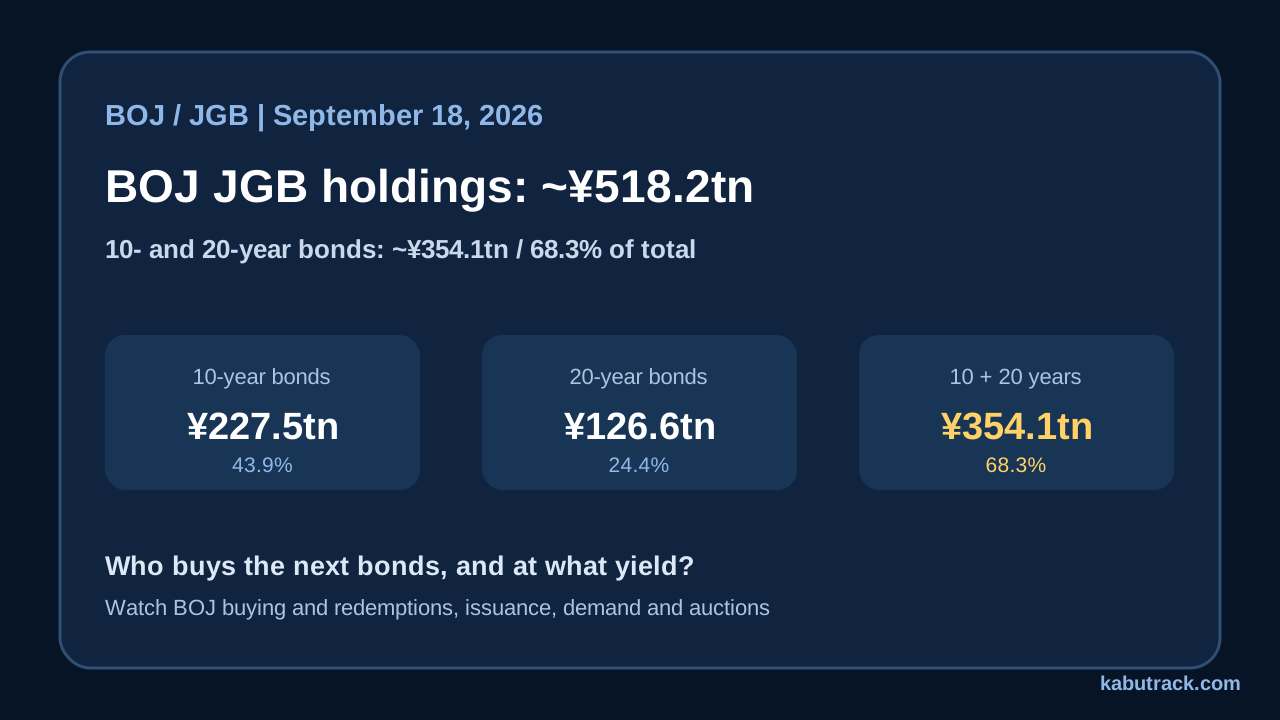
¥518 trillion is an eye-catching figure. Broken down by original maturity, about ¥227.5 trillion is in 10-year bonds and ¥126.6 trillion in 20-year bonds. But the market's next concern is who will absorb new JGBs as BOJ purchases taper.
The BOJ has kept its plan to reduce monthly purchases to around ¥2 trillion in January–March 2027. That figure alone does not tell us how many bonds the private sector will need to absorb. New issuance, refinancing, and maturing bonds all matter. At what yields will buyers show up at auction, and will they be banks, life insurers, pension funds, or overseas investors? Those questions are needed to assess supply and demand.
Holdings by Original Maturity Total About ¥518.2 Trillion
The issue-level holdings, grouped by original maturity, are shown below. These are face-value amounts, converted from the BOJ's published figures in units of ¥100 million to trillions of yen.
| Bond type | BOJ holdings | Share of total |
|---|---|---|
| 2-year | About ¥11.85tn | 2.3% |
| 5-year | About ¥81.45tn | 15.7% |
| 10-year | About ¥227.53tn | 43.9% |
| 20-year | About ¥126.58tn | 24.4% |
| 30-year | About ¥52.91tn | 10.2% |
| 40-year | About ¥11.61tn | 2.2% |
| 5-year Climate Transition Bond | About ¥0.76tn | 0.1% |
| 10-year Climate Transition Bond | About ¥0.81tn | 0.2% |
| Inflation-indexed bond | About ¥4.70tn | 0.9% |
| Total | About ¥518.20tn | 100% |
*Each share is rounded to one decimal place.*
Ten-year bonds are the largest maturity group. Together with 20-year bonds, they account for 68.3% of the total, close to seven-tenths. Their weight stands out in the table. That mix does not, by itself, show that the BOJ particularly favored those maturities: issuance volumes and past purchase amounts also differ. To compare the BOJ's presence across maturities, it would help to look at its holdings as a share of the outstanding issuance in each one.
Current Pricing Depends on Both Holdings and the Next Buyer
The BOJ plans to reduce its scheduled purchases of long-term JGBs in stages, reaching about ¥2 trillion a month in January–March 2027. That is a planned flow of BOJ purchases, not the market's total net supply. New issues, refinancing, redemptions, and BOJ purchases together determine how much the private sector must absorb.
Calling all buyers the “private sector” also hides important differences. Life insurers may consider superlong bonds to match the duration of their liabilities under asset-liability management (ALM), but their demand is not always strong. Overseas demand for yen bonds also depends on currency hedging costs and yen funding conditions. The BOJ's fiscal 2025 market operations report records periods when life insurers were cautious about adding superlong bonds while overseas investors and trust banks supported demand. A “strong auction” means something different depending on who bought.
At JGB auctions, the bid-to-cover ratio is not the only figure to watch. The auction tail—the difference between the average accepted price and the lowest accepted price—can also be revealing. A wider tail may suggest participants disagreed more about price. As BOJ purchases decline, it offers a clue to the yield at which demand appeared.
Even if BOJ holdings fall, strong private demand can restrain a rise in yields. If auctions remain weak despite the announced purchase reductions, concerns about supply and demand may persist. Holdings should not be mapped directly onto yields; the question is who bid, and at what yield.
Superlong Bonds: Supply Changes Alongside Demand
The BOJ's combined holdings of 20-, 30-, and 40-year bonds are about ¥191.1 trillion. For these superlong maturities, supply and demand depend both on who replaces BOJ buying and on how much the government issues.
The Ministry of Finance's initial fiscal 2026 issuance plan cut monthly issuance of 20-, 30-, and 40-year bonds by ¥100 billion each, taking into account weaker demand from life insurers and other factors. When demand weakens, the issuer can reduce supply too. That adjustment matters particularly at the long end. Will auctions stabilize after the cuts, or will buyers still require higher yields? Superlong yields cannot be read from BOJ meetings alone; the yield level at which life insurers' ALM demand returns also matters.
At the Ministry of Finance's June meeting with JGB investors, some participants said supply and demand for superlong bonds were improving after the issuance cuts. Others noted that uncertainty over fiscal management and other factors had stalled buying of 10-year bonds. If the issuance plan is already priced in, subsequent auction results offer the next clue.
For Stocks, Watch Which Part of the Yield Curve Moves
When 10- and 20-year yields rise, the first things to examine are banks' and insurers' investment income and the valuation of their existing bond holdings. Higher yields help on newly invested funds, but a rapid rise can increase unrealized losses on existing bonds and hedging costs. The pace of the move and the shape of the yield curve matter as well as the yield level.
For property companies and REITs, long-term yields affect borrowing costs and the yields investors require from properties. The effects vary by company, so borrowing maturities and the mix of fixed- and floating-rate debt also need attention.
Figures to Track Next
- BOJ purchase plans and holdings: How reduced purchase flows show up in holdings after redemptions.
- Ministry of Finance issuance and auction results: Issuance by maturity, bid-to-cover ratios, and tails together show the yields at which bonds were absorbed.
- JGB yields by maturity: Compare moves in 10-, 20-, and 30-year yields to see where supply-demand pressure emerges.
What This Holdings Table Can—and Cannot—Show
This table is a snapshot of BOJ holdings as of September 18, 2026. It does not show changes from the previous observation, the BOJ's share of outstanding bonds at each maturity, or shifts in private investors' holdings. The table alone cannot establish why yields rose. Purchase, redemption, issuance, auction, and investor-flow data must be compared to see where supply and demand changed.
Conclusion
The BOJ held about ¥518.2 trillion in interest-bearing JGBs, with 10- and 20-year bonds accounting for about ¥354.1 trillion, or 68.3% of the total. That mix is a starting point for understanding the market, not an answer about where yields will go.
The size and maturity profile of BOJ holdings provide the backdrop for supply and demand. To follow yields, look at the flows of purchases, redemptions, and issuance alongside auctions. The market's question is who will absorb that supply, and at what yield.
Related Articles
- Can another BOJ rate hike coexist with inflation relief? Subsidies, wages, and household costs
- The BOJ's core CPI excluding special factors accelerates to 2.6%: Trimmed mean 2.16%, median 1.54%
Sources
- Bank of Japan: Outstanding Balance of JGBs Held by the Bank of Japan by Issue
- Bank of Japan: Outstanding Balance of JGBs Held by the Bank of Japan by Issue (September 18, 2026), XLSX
- Bank of Japan: Plan for Purchases of Japanese Government Bonds (June 2026 Monetary Policy Meeting)
- Bank of Japan: Money Market Operations in Fiscal 2025
- Ministry of Finance: Fiscal 2026 JGB Issuance Plan
- Ministry of Finance: Minutes of the 100th Meeting with JGB Investors
- Ministry of Finance: Auction Calendar
- Ministry of Finance: Market Participants' Interpretation of Auction Results
*The BOJ figures cover settled holdings of interest-bearing JGBs. Face values published in units of ¥100 million are rounded to the nearest ¥100 million. Changes arising from transactions with the government, as well as JGB purchase operations, are reflected.*